Website uptime monitoring should answer a practical question: can people use the site for the tasks that matter? A successful response from the homepage is a useful signal, but it cannot tell you whether an article loads comfortably, a search returns results or an account journey completes.
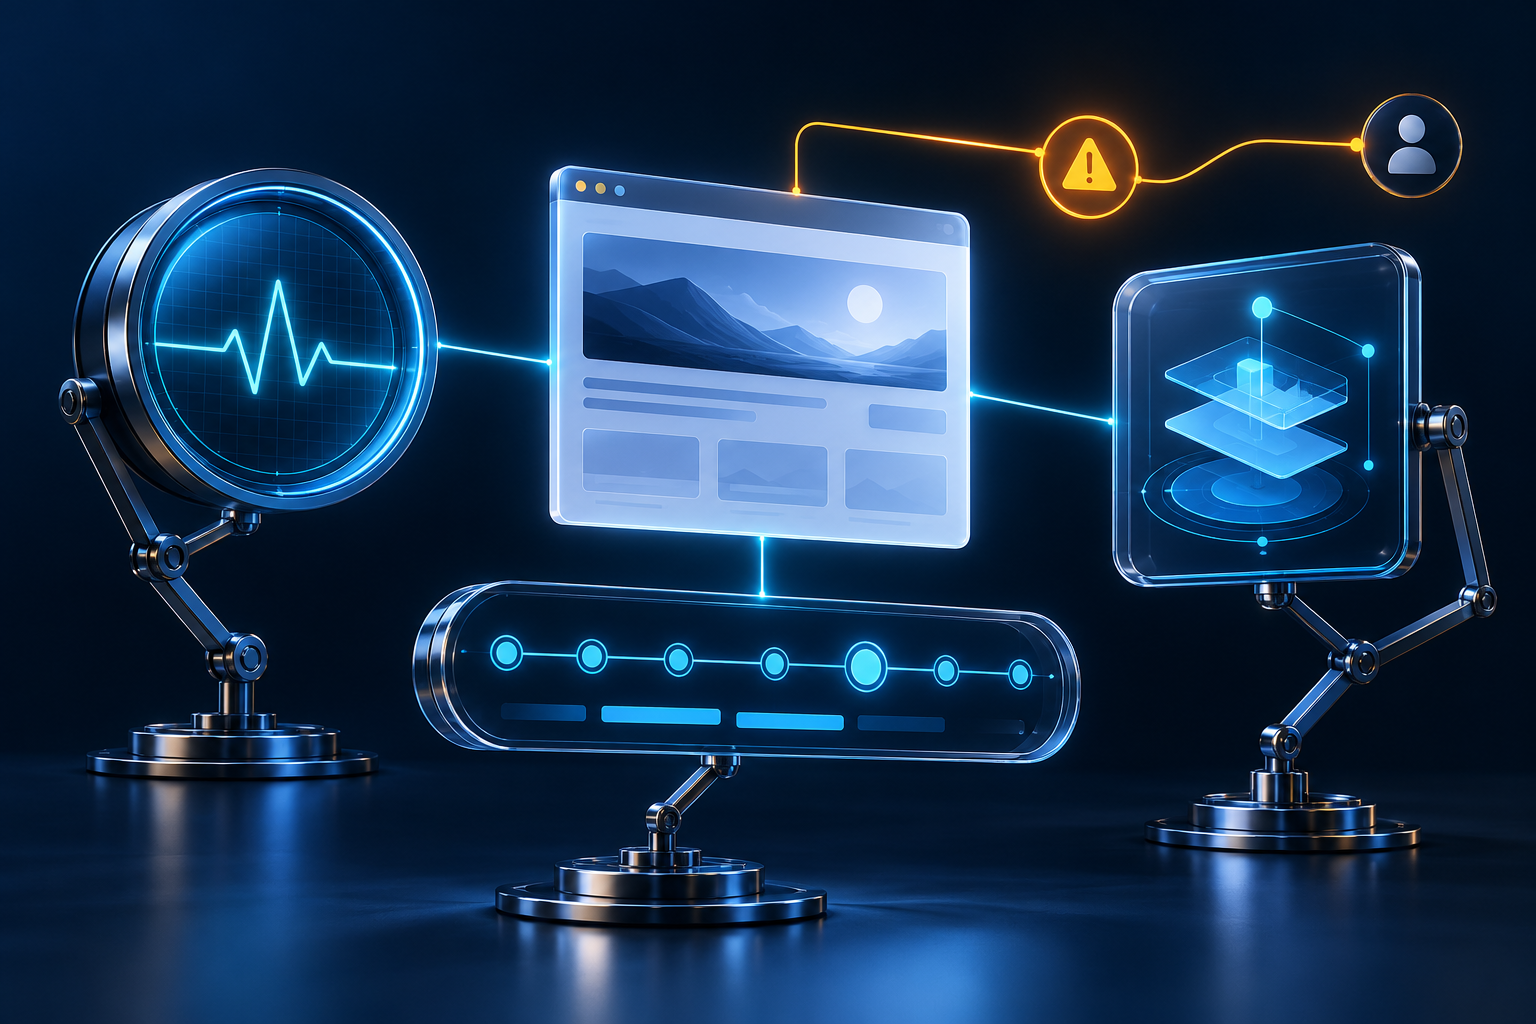
Build a small set of complementary checks rather than one impressive score. Availability, functional behavior and user experience each reveal a different kind of problem. This guide proposes a monitoring approach; no monitor, alert or performance test was installed or run for it.
Website uptime monitoring starts with a definition
Define what a successful check means before choosing its frequency. Is the requirement a reachable URL, an expected status, recognizable page content or a completed read-only journey? A server can return an error message inside a successful HTTP response, so the success condition should reflect the service you intend to observe.
Google Cloud’s monitoring overview explains that uptime checks succeed when the resource responds and the configured requirements are met. It also distinguishes simple checks from synthetic monitors that test a sequence. The example illustrates a broader principle: a green indicator means the configured test passed, not that every feature works.
Choose representative destinations. A publication might monitor its homepage, a recent article and its search interface. A shop needs different coverage. Keep checks read-only where possible, and use a suitable test environment or approved test data when a journey could send messages, create records or make a payment.
Observe from more than one perspective
An external check can observe failures that the application itself cannot report, such as an unreachable site. Internal logs and resource metrics help explain what happened inside the hosting environment. Neither replaces the other: an application log cannot record a request that never reached it, and an external probe cannot diagnose every database problem.
Select check locations appropriate to your audience and the monitoring product. Google documents public uptime checks from multiple regions, while private checks address a different access problem. Do not assume that one successful probe represents all users or that a checker can reach an authenticated or private service without specific configuration.
Treat monitoring access as operational access. Avoid placing privileged account details in publicly reachable check URLs or ordinary alert messages. If an authenticated test is necessary, use the product’s supported credential handling and the minimum access required. Document who maintains that access when accounts or ownership change.
Measure experience, not only response time
A quick server reply can still lead to a slow or unstable page. Google’s Web Vitals guidance describes loading, interactivity and visual stability through Largest Contentful Paint, Interaction to Next Paint and Cumulative Layout Shift. These measurements look at different aspects of the experience rather than treating every delay as server response time.
The same guidance evaluates the recommended targets at the 75th percentile, with mobile and desktop considered separately. Averages can obscure a group having a poor experience. Keep the page type, device grouping and observation period with each result so you know what the measurement represents.
For an editorial site, inspect an article with a typical image and content structure, not only a lightweight homepage. Compare important templates and realistic interactions. A stable loading result does not establish that a menu is usable or that a long table fits a phone, so functional and visual checks still have a role.
| Signal | Useful question | Important limitation |
|---|---|---|
| Uptime probe | Does the configured check pass? | Only its chosen path and conditions |
| Synthetic journey | Can a defined task complete? | Only the scripted scenario |
| Lab performance test | What happens under set conditions? | Not every real user’s experience |
| Field measurements | What do eligible visits experience? | Coverage and aggregation matter |
| Logs and resources | What happened inside the system? | May not explain external failures |
Separate lab and field results
Google’s lab-versus-field explanation distinguishes controlled test conditions from measurements of actual visits. A lab run helps reproduce and investigate a problem. Field data reflects varying devices, networks and behavior. A difference between the two is not automatically evidence that one tool is broken.
Lighthouse’s scoring documentation explains that underlying conditions can make results fluctuate. Record the tool, device settings, page state and network conditions before comparing runs. A single better score after a change is a lead to investigate, not enough to attribute every difference to that change.
Public field datasets also have coverage requirements. The Chrome UX Report methodology describes eligibility and popularity criteria. A missing page-level field report does not mean the site is fast or slow; it may mean the dataset does not include enough eligible information for that page.
Make alerts actionable
Decide who receives a failure, how long it must persist and what that person should do. A dashboard without an owner can document an outage without shortening it. Start with a small number of meaningful conditions and refine them based on actual incidents, rather than forwarding every transient fluctuation.
Google’s uptime-alert guidance separates the check from its alerting policy and configured notification channels. Other products use their own setup, but the distinction remains useful: creating a check is not evidence that someone will receive and understand its failures.
Test the notification path using the product’s supported method or an isolated controlled failure. Confirm receipt, useful context and a clear owner without deliberately disrupting production. Include the affected check, time, destination and a short investigation guide, while keeping credentials and private visitor data out of the message.
A small monitoring plan in practice
Imagine a fictional publication that monitors a homepage and representative article. Both probes pass, but readers report that search is unusable. The lesson is not that uptime checks are worthless; it is that the monitored success condition did not cover the failing task. Add a suitable read-only search check and keep the original probes for their separate purpose.
If a performance regression appears after a release, compare the affected template and relevant resource behavior before reverting unrelated changes. Retain the before-and-after conditions and note any concurrent advertisements, cache changes or traffic differences. This is a proposed investigation method, not a measured incident on Technosiastic.
Keep an incident note that separates observations from explanations. Record what failed, which users or paths were affected, when it started and what evidence supports the suspected cause. A useful monitoring system helps collect those facts without making a confident diagnosis from a single red indicator.
Build a review routine
- Define the important reader or customer tasks and their success conditions.
- Choose a small set of external checks plus relevant internal evidence.
- Measure representative templates and distinguish lab from field results.
- Assign alert ownership and test the notification path safely.
- Keep deployment and configuration context with incident observations.
- Review missed incidents and noisy alerts, then adjust coverage deliberately.
Monitoring also needs maintenance. Update checks when routes, page content or authentication change, and remove obsolete tests deliberately. A failing assertion may indicate an outdated test rather than an unavailable site; investigate both possibilities. Keep the reason for each check visible so it does not become an unexplained source of noise.
Good website monitoring turns observations into useful decisions. Check availability, test important tasks, measure user experience and make sure an owner can respond. The goal is a system that reveals meaningful failures and helps explain them, not a perfect-looking dashboard that watches the wrong thing.